


If you have a small company that needs a warehouse management software, we recommend our free and publicly available warehouse inventory spreadsheet in Google Spreadsheets
HELPEXCEL DEVELOPER PROJECT
Warehouse accounting and analysis of shipments table
If you have a small company that needs a warehouse management software, we recommend our free and publicly available warehouse inventory spreadsheet in Google Spreadsheets
HELPEXCEL DEVELOPER PROJECT
Warehouse accounting and analysis of shipments table
Main features
If you have a small company that needs a warehouse management software, we recommend our free and publicly available warehouse inventory spreadsheet in Google Spreadsheets.
You can track arrears in payments for goods as you fill in the purchase and shipment sheets. The table contains information for stock balances and cost of goods. Also, it generates reports for ABC and XYZ analysis
All this information will help you understand which products are worth investing in and which are not. In order to use 100% of the capabilities of our spreadsheet, we advise you to read this small guide.
Setting up
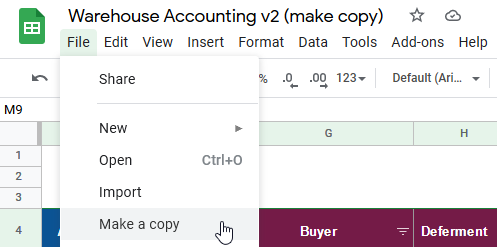
1. Open spreadsheet and make a copy
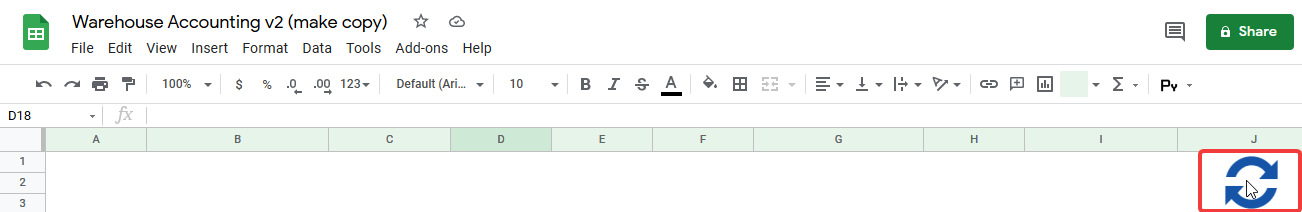
2. The table works correctly only if you pass authorization. To do this, click this icon on the "Shipments" sheet
Next, such window will appear
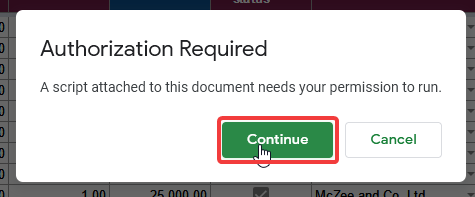
Click “Continue”
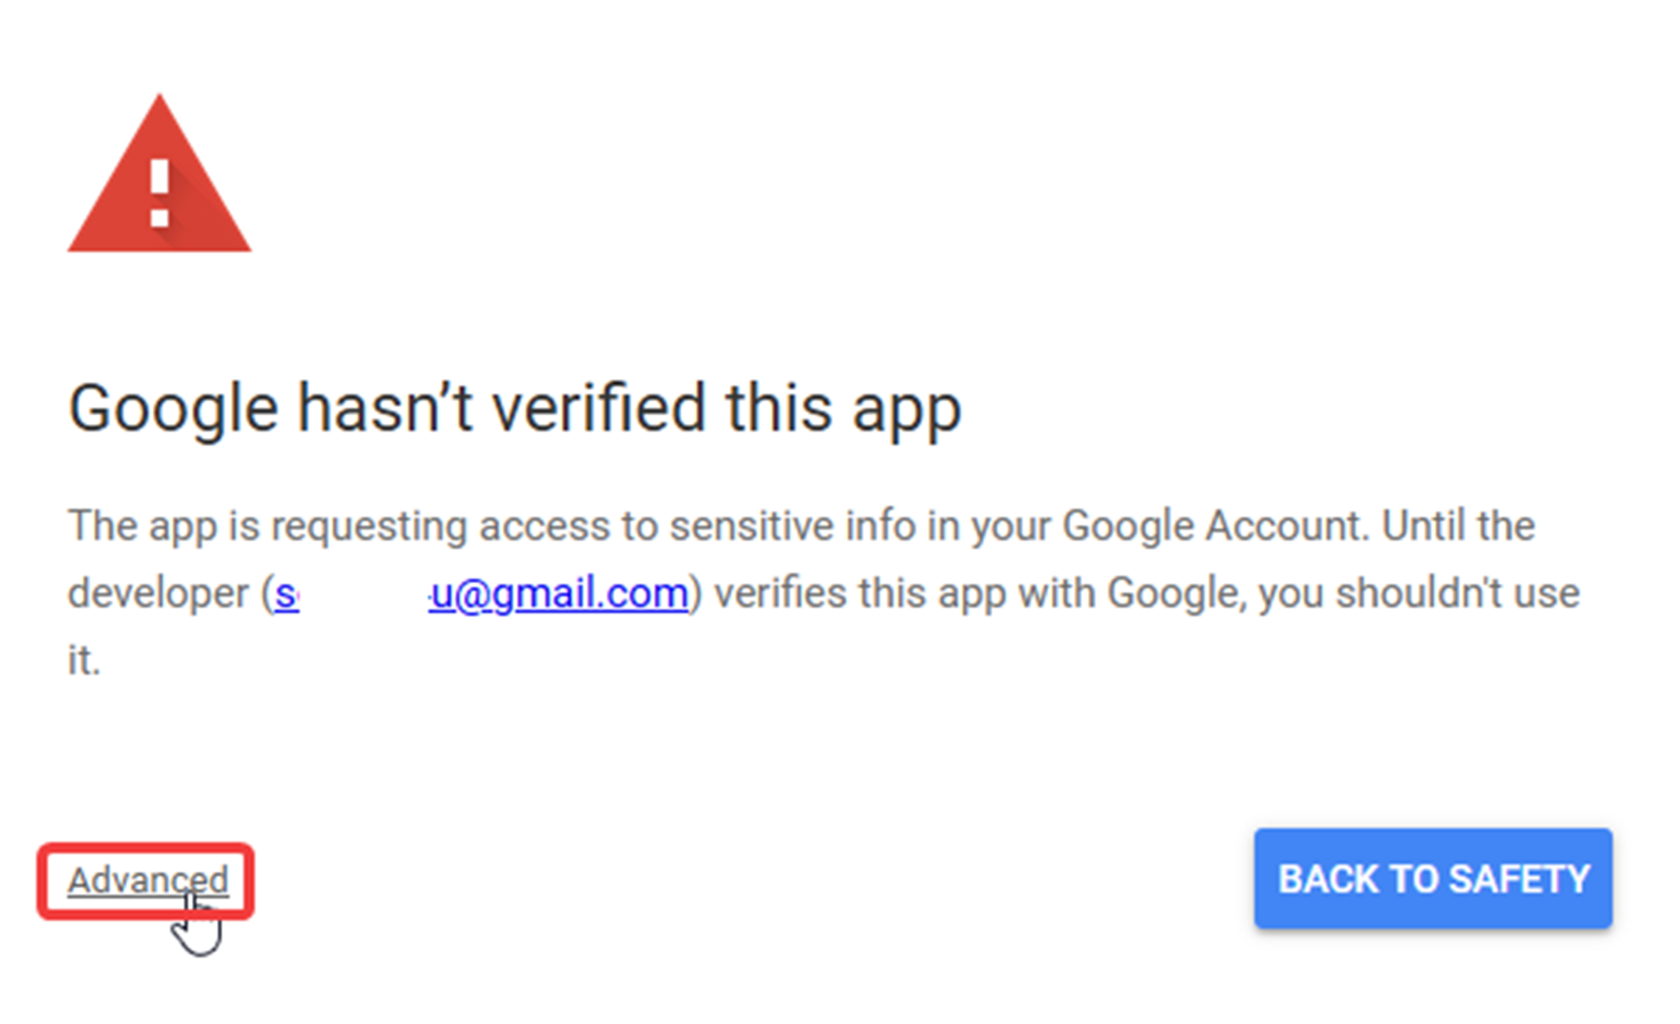
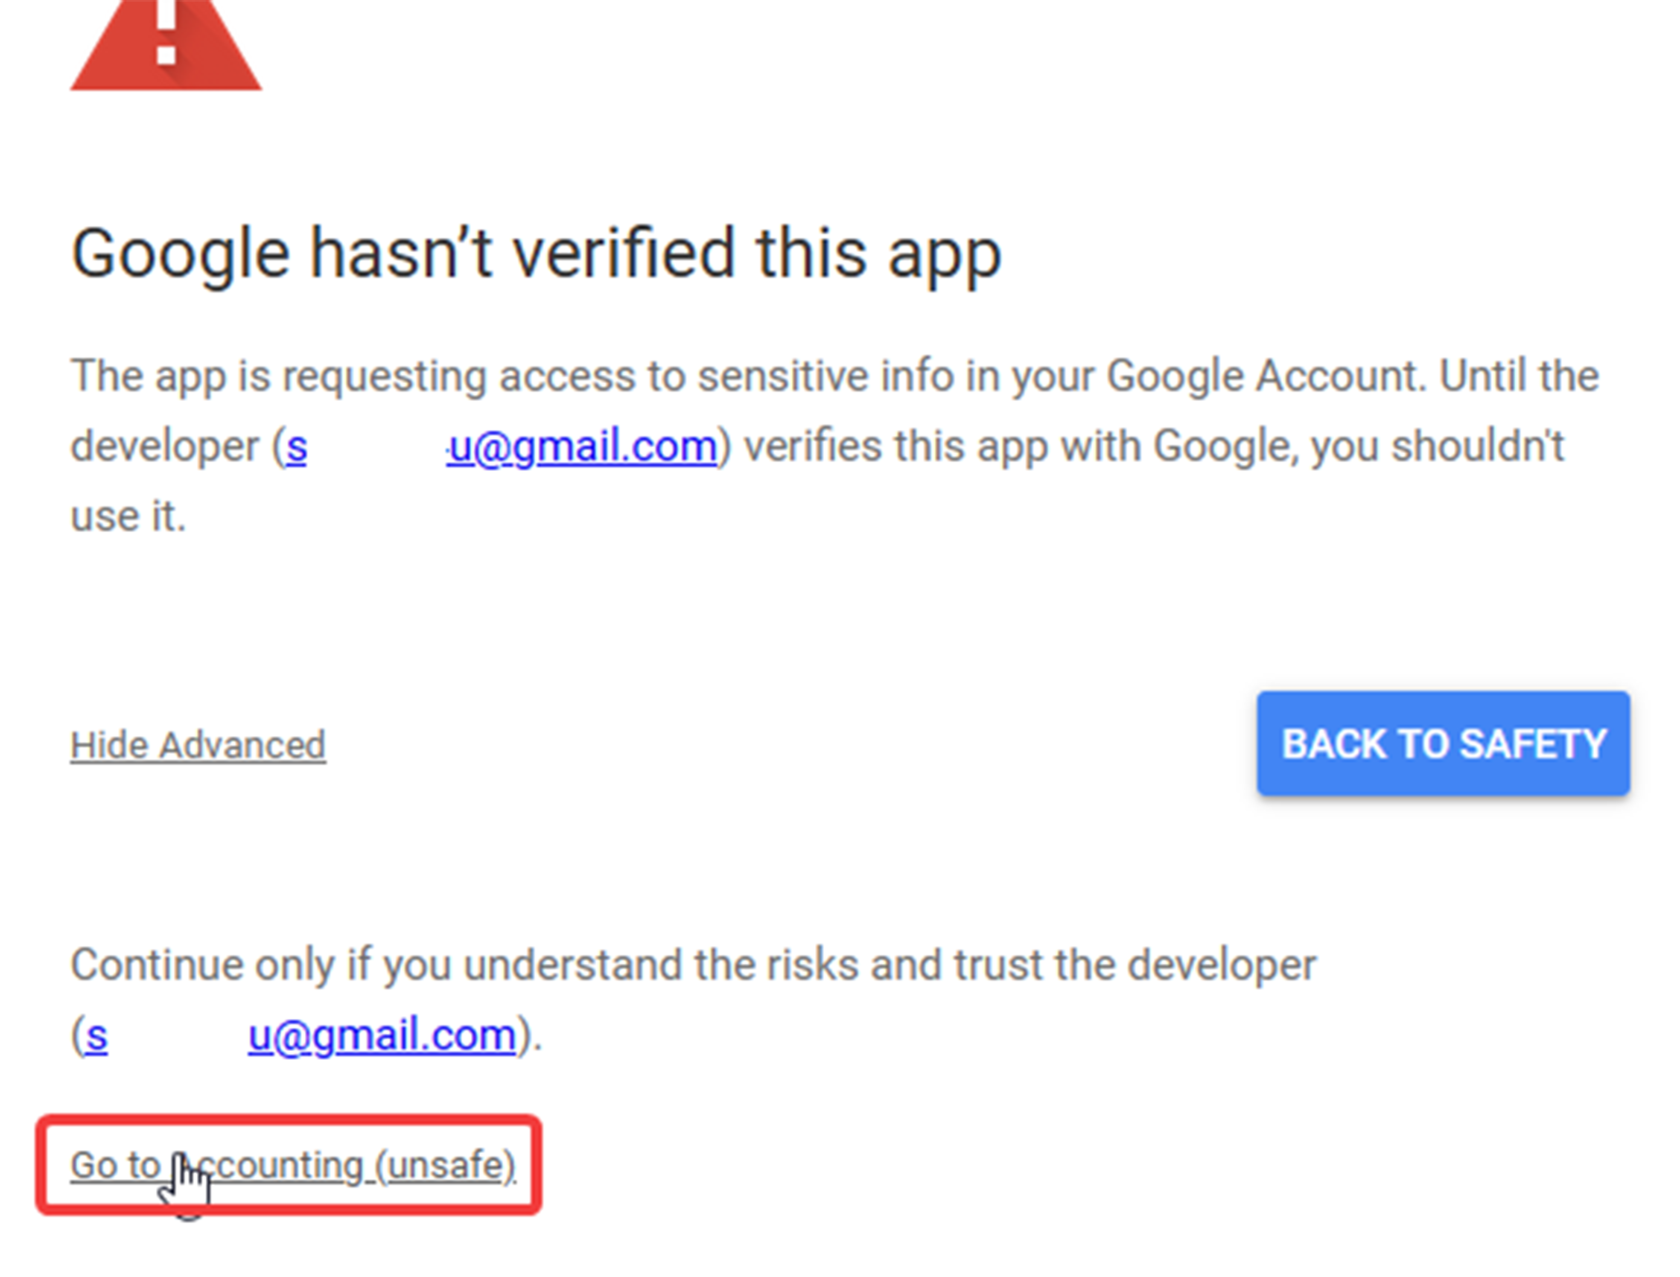
Then, use your Google account or create new one. In next window click on "Advanced"
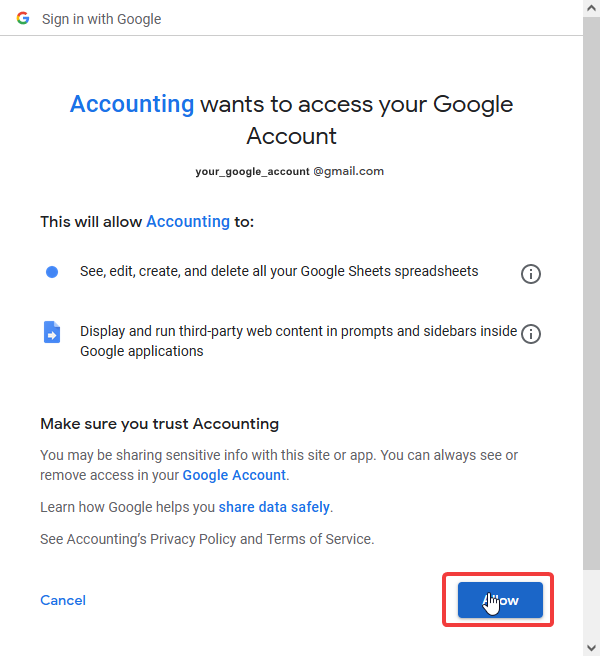
Click “Go to Accounting (unsafe)”
Then “Allow”
Excellent! The table will now work correctly.
3. Before you start working with the spreadsheet, you must choose a cost price calculation method. This is needed to calculate profitability, stock values and profits. The field with the choice of the method can be found on the “Reference” sheet.

Average, FIFO method and LIFO method. Next, we'll take a look at each of them.
There are 3 calculation methods
Arrival average price
According to this method, the cost price is taken as the average value for the period that you select.
Let's say you have selected a period of 20 days.
20 days ago you bought one item for 100 dollars, one item for 150 dollars 15 days ago, and another one for 200 dollars 7 days ago.
In this example, the purchase price will be $ 150.
FIFO method - “First in - first out”
For example, you bought 2 pens at $ 5 per piece and later 2 of the same for $ 6. Let’s say we sold one pen right after.
According to the FIFO method, you need to take a pen that was purchased earlier than anyone else in time. That is, the price is $ 5. Then, the cost of the rest of the goods will be made up of 1 pen worth $ 5 and 2 pens worth $ 6. The total cost of the remaining 3 pens is $ 17.
LIFO method - "Last in - first out"
Let's use the same example with pens. Purchased 2 pens at $ 5 per piece. and later another 2 for $ 6.
Then, the cost of the rest of the goods will be made up of 2 pens worth $ 5 rubles and 1 pen worth $ 6. The total cost of the remaining 3 pens is $ 16.
Which method should you choose?
It is better to choose the average cost method for goods, which prices often change both up and down.
The FIFO method allows you to get rid of the remains of old goods in the warehouse. Quite often it is used where older goods in the warehouse are consumed first. For example, with goods with a short shelf life. Also, it is better to use it if the price of goods is steadily declining.
The LIFO method is suitable when the price of goods is steadily increasing. If you use FIFO instead, you will overestimate your profit because you will be working with irrelevant cost information.
That's all! You have successfully configured the table and you can use it now!
Working with tables
Let’s talk about your workflow with our spreadsheet
You fill in 3 sheets: "Purchases", "Shipments" and "References".
In “Purchases” information is filled in about the goods that you have bought, and in “Shipments” - on the goods that were bought from you.|
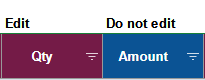
"References" sheet is needed to store names of goods, suppliers and buyers. The columns in the table are in two colors.
Magenta (first in the picture) is filled in by you. In the blue column (the second in the picture), the values are calculated automatically. You don’t need to edit these columns manually.
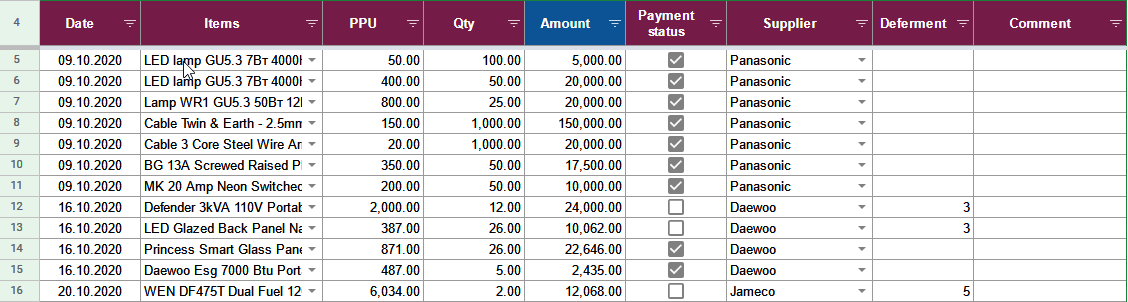
Purchases sheet
Date column
Fill in the date on which you received the goods.
Items column
Contains names of the goods that arrived. You can pick it with dropdown menu. But make sure you have added it to the “Items” column in the “References” sheet:
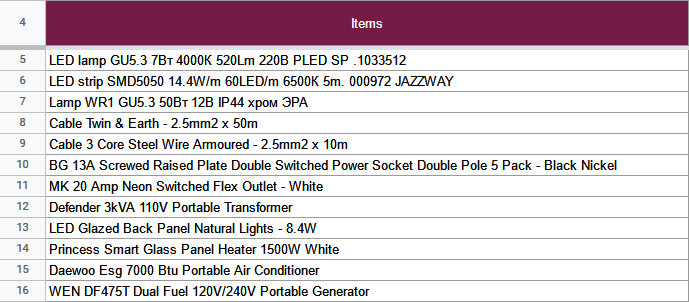
After that, you can select the product you need:
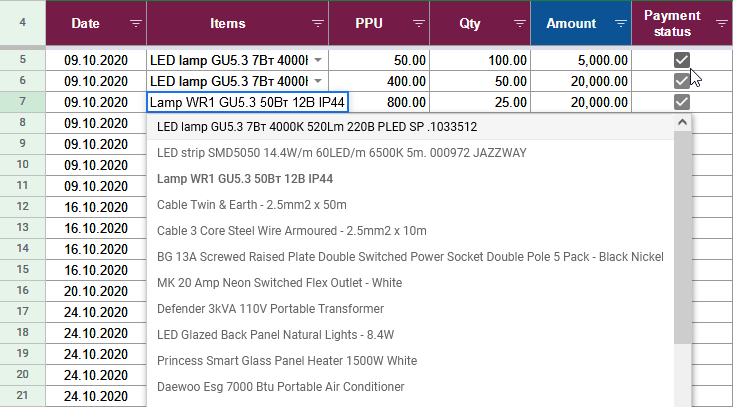
PPU - The purchase Price Per Unit
Qty - Quantity of goods
Amount - The values in this column are calculated automatically. You do not need to enter anything manually. The total amount for the received items is shown here.
Payment Status, Supplier and Grace Days
The supplier of the product is added to the Supplier column. But first you need to add it to the Suppliers column on the References sheet. Just like the name of the product.
Sometimes the goods are shipped to you, but you have to pay for it after a while. Then leave the column “Payment status” empty and write in the Deferment column the number of days to pay. After that, the following line should appear in the Accounts payable column on the “Analytics” sheet:
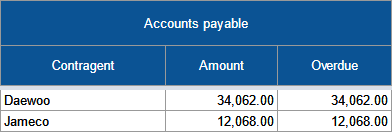
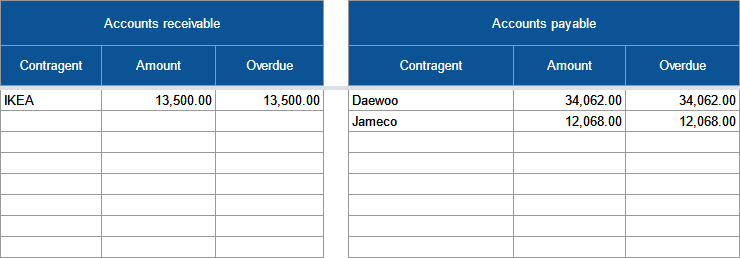
Contragent - to whom you owe. Amount - how much.
If the payment date has already passed, then the amount will appear in the Overdue column.
In case you paid for the goods immediately, then just put a tick in the Payment status column.
Shipments sheet
Date, Items, Price Per Unit (PPU), Qty, Amount, Payment status, Buyer and Deferment columns - likewise with the Purchases sheet but refers to the shipped products.
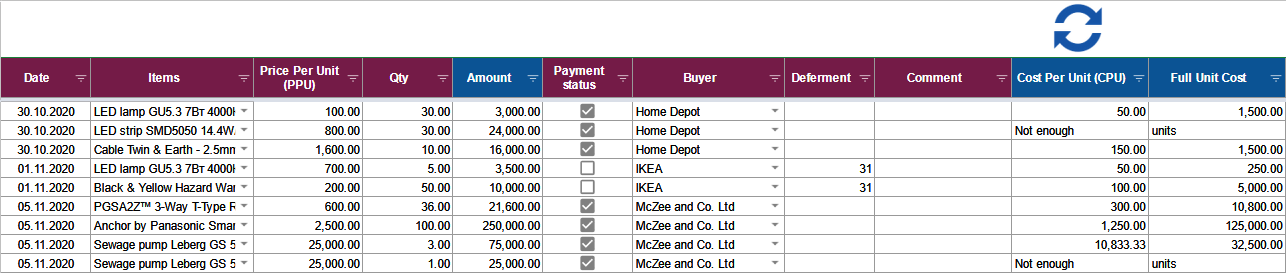
After you have filled in at least one line both in the Purchases and Shipments sheet, click on the update icon on the Shipments sheet:
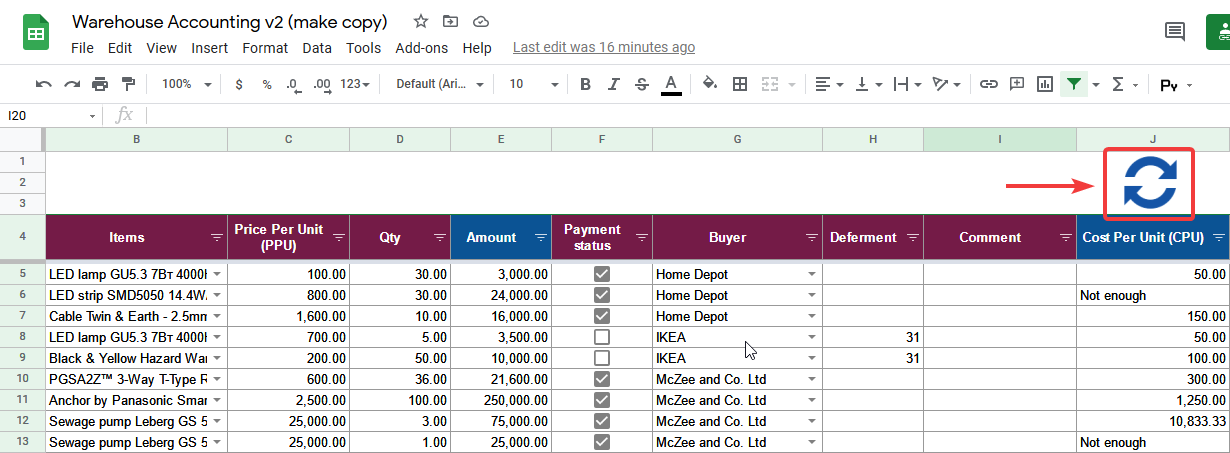
After that, these columns will be filled:
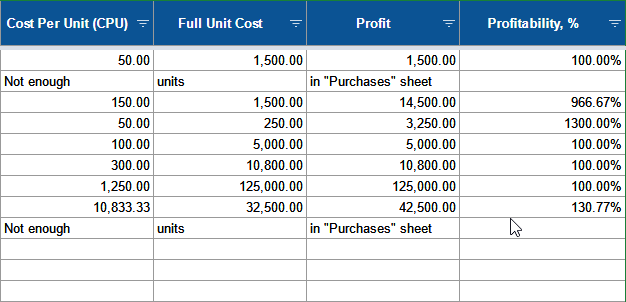
Cost Per Unit (CPU) and Full Unit Cost columns
Cost of goods. Calculated using the average receipt price, FIFO or LIFO method. The description of the methods is at the beginning of the article.
Full Unit Cost = CPU * quantity of items shipped
Profit
The amount by which income exceeds costs
Profitability
Profitability is profit divided by the amount of the cost price as a percentage
This is an indicator of the economic efficiency from the sale of a product.
Analytics sheet
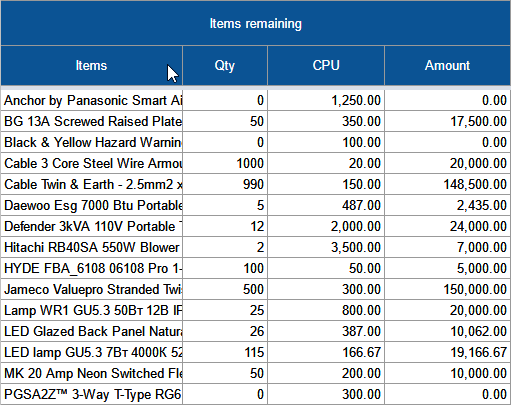
Items remaining
Shows the remainder of the goods in the warehouse, cost prices and amounts:
Accounts Receivable and Accounts Payable
Accounts receivable is the amount that buyers owe you. Accounts payable is the amount you owe to suppliers.
XYZ analysis
Shows how the demand for a product changes during the year.
It’s divided into 3 groups:
X - products that are consistently sold throughout the year. With slight fluctuations in demand. Easy enough to predict
Y - seasonal items. Medium forecasting ability.
Z - goods with irregular demand. No particular trends. The forecasting accuracy is low.
The goods are distributed automatically.
ABC analysis
Divides products into groups in terms of their profitability or sales volume. Products are divided into 3 groups A, B and C:
A: 80% of sales/profits share, often 15-20% of all products.
B: 15% of sales/profits share, often 35-20% of all products.
C: 5% of sales/profits share, often 50-60% of all products.
The goods are distributed automatically.
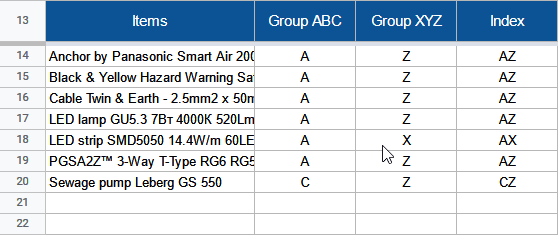
ABC XYZ
This sheet contains data from ABC and XYZ analysis. It distributes goods into 9 groups:
AX - significant share of revenue, demand is stable;
AY - a significant share of revenue, demand is subject to fluctuations;
AZ - a significant share of revenue, demand is poorly predicted;
BX - average volumes of revenue, demand is stable;
BY - average revenue, demand is subject to fluctuations;
BZ - average volumes of revenue, demand is poorly predicted
CX - low profit, stable demand;
CY - low level of profit, demand is subject to fluctuations;
CZ - low profit level, demand is poorly predicted.
Example:
Thank you for reading our entire tutorial!
If you still have questions about spreadsheet, you can ask them in our Telegram chat
If you still have questions about spreadsheet, you can ask them in our Telegram chat